Sep 28, 2022

The Association of Pedestrian and Bicycle Professionals (APBP) 2022 conference was held last month in Minneapolis, Minnesota.

Association of Pedestrian and Bicycle Professionals (APBP) Conference Takeaways

The Association of Pedestrian and Bicycle Professionals (APBP) 2022 conference was held last month in Minneapolis, Minnesota. Drew Ackermann (he/him) from our Washington, DC office attended to connect with other people working in pedestrian and bicycle planning, and to take in the latest insights from public agencies, advocates, elected officials, and other consultants. Here are a few of Drew’s takeaways from the conference sessions.

Navigational Clarity for People Walking, Rolling, and Biking

Several APBP sessions covered the nuts and bolts of making bike and pedestrian infrastructure easy for people of all ages and abilities to use. This goal often goes unrealized in areas where sidewalks and bikeways intermingle and it’s not clear where a person walking, rolling, or biking should go. While it’s great that cities are building more sidewalks and bikeways, placing them close together without effective visual, audial, and tactile cues creates confusion, particularly for those with low vision or hearing. One session discussed a few common pitfalls:

  • Lack of vertical separation or detectable edge between a bikeway and sidewalk, leading people walking or rolling to mistakenly use the bikeway
  • Directional indicators (raised bar surfaces that guide blind or low-vision pedestrians along a walkway) that are too close to a walkway’s edge
  • Bikeway designs that place pedestrians waiting to cross an intersection within a bikeway’s path

Real-life Lessons in Street Design

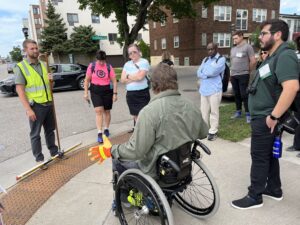
While we love design manuals and site plans, nothing beats a field trip to see how a street works in real life. The conference included some excellent mobile tours of bikeways, greenways, pedestrian malls, and transit station areas around the Twin Cities. We were able to see first-hand how a bikeway was configured to accommodate wide fire truck turns, the importance of curb ramp grades for wheelchair users, how directional indicators can be installed so snowplows don’t chip them, the trade-offs between sidewalk-level bikeways (which are easier to sweep or plow) and street-level bikeways (whose vertical separation from the sidewalk helps with the navigation challenges mentioned above), and so many other details that can make – or not make – streets safe and comfortable for people walking, rolling, and biking.

Remediating Racial Injustice in Transportation

A theme throughout the conference was the vital and urgent task of addressing past and present racial injustice in transportation. Sessions included compelling research on the disproportionate burdens of traffic violence, ticketing, and restriction of movement that are placed on people of color, especially Black and Indigenous people. Speakers outlined the racial harm caused by roadway design, land use planning, policing, and public engagement, and challenged us with strategies for centering racial justice in bike and pedestrian planning.

It was great participating in the 2022 APBP Conference. Our sincere thanks to the presenters and speakers who shared their insights. If you want to learn more about the speakers or the conference itself, you can do so here.

Tollbooth-style PUDO

Scramble-style PUDO

A scramble-style PUDO refers to when some (or all) students are being dropped off or picked up on the street, not an adjacent sidewalk, and walking between cars. For scrambles, some cars drive into a designated area, and then they all stop and don’t move again until all students arrive safely at the school or in their car at dismissal. Scrambles are often used during dismissal for schools with limited sidewalks since a scramble allows for more cars to load simultaneously.

Scramble-style PUDO

When helping plan a school, what does Gorove Slade recommend? In short, all of them. Our recommendation is to design a PUDO facility that can be flexible and work for several operational styles. Once up and running, the staff and teachers can try several and see what works best. The goal is to give them the tools they need to find the best solution.

An example is the new Cardinal Elementary School in Arlington, VA. We recommended a flexible system with ample sidewalks and a bypass lane, and once it was up and running, the facility operated a bit differently than planned. At dismissal, teachers split the facility in two, with two pick-up waiting spots – one for younger grades closer to the school and one for older ones further away. This allowed for quicker matching at dismissal times.

Afternoon pick-up at Cardinal Elementary School

PUDO Analysis

Gorove Slade handles the analysis of PUDO facilities in several ways. They are inherently tricky to analyze because some operational details are challenging to model, and the significant demand is very sensitive to variables leading to large ranges of results.

Here are three ways we approach analyzing PUDO:

Queuing Analysis/Equations

One method is to use classic queuing equations, which transportation engineers have used for decades for toll booths. They are based on three factors: the arrival rate of cars, the number of booths, and the processing speed of the toll. All three of these factors correspond to PUDO facilities.

Even so, queuing equations often fail to get accurate results for PUDO facilities. For example, we were working for a private school with a notorious PUDO problem at dismissal, so we went to the field and measured the arrival rate of cars, the number of vehicles that could load simultaneously, and the average time for each pick-up. We then entered that information into our queuing models, which then told us the queue should be negative, or in other words, there shouldn’t be a queue at all, as the car arrival rate was less than the overall number of cars that could be processed.

Subsequently, we returned to our observation notes and video. We realized the longest queue in the field was when dismissal began and that our model was correct in that the queue was being processed faster than additional cars arrived. Parents and guardians arrived so early that they stacked up well beyond the school property, but once dismissal started, the queue only got shorter as more cars showed up.

The lesson we learned here is that there are more factors in the queuing analysis than just the traditional three and that arrival rates are not random.

Comparable Analysis

A common transportation engineering practice is to study comparable locations, and sometimes, that works well for PUDO facilities, especially when queuing equations don’t work as described above. We’ve taken max queue data at several private and public schools. We can try to match the car length per student ratio from a site comparable to the one we’re working on, given the design and operational elements of their PUDO.

There are two issues with using comparable data. The first one is that there’s an extensive range of data, so using our observed data leads to a max queue range of 0.10 to 0.20 cars per student being picked up. The wide range is due to how well the PUDO processes traffic and the starting queue length. To use these ratios, you need to estimate how well the PUDO will operate within this range.

But more importantly, our observations found some schools with a max queue under the 0.10 cars per student range during dismissal. This wasn’t because they had fewer cars picking up students; it was because the cars weren’t all in the same place. For example, the school we observed once had around 25 to 30 cars picking up simultaneously, but only six were at the official pick-up spot at the front door. The others were in the parking lot or curbside in several locations. So, when planning PUDO facilities, the ability of parents to use informal locations near the school can be a huge factor in the max queues and overall PUDO operations.

VISSIM Modeling

When something other than engineering judgment combined with the two analyses stiles above is desired, we turn to detailed traffic models using the VISSIM software platform. VISSIM models are highly detailed and can account for things like starting queues and varying arrival rates. The main drawback is that they require more time and resources to assemble, and in the end, they still can’t arrive at a perfect representation of a PUDO since human behavior is always a factor.

Thoughtful design and operations can dramatically improve the pick-up and drop-off process. Whether planning a brand new PUDO experience or improving existing operations, the principles and methods discussed here provide a framework for tackling one of the most persistent logistical challenges for administrators and parents alike. By considering key factors like demand patterns, operational strategies, and facility types, schools can create systems that minimize queuing, reduce neighborhood impacts, and make the beginning and end of the school day better for all.