Jul 20, 2023

Microsimulation models are one of the most effective tools transportation engineers use to evaluate future changes to transportation networks.

Frequently Asked Questions - VISSIM

What is VISSIM? 

VISSIM is the preeminent microsimulation software tool in the transportation field, designed to predict how transportation networks will respond to various changes and conditions at a very granular level of detail. Transportation planners and engineers use microsimulation models to iterate through multiple design alternatives, identify possible conflicts, and recommend areas for improvement. This allows for more informed decision-making when planning future developments. 

VISSIM is considered to be an “advanced” modeling tool. “What makes VISSIM “advanced” in the context of traffic modeling is that every vehicle, bus, train, pedestrian, and cyclist is treated as an individual data point, tracked throughout its journey within the network. Attributes of each data point like speed, route, stops, acceleration, deceleration, and occupancy are recorded from the moment it enters the network to the moment it leaves. The level of detail doesn’t stop there. The model network can replicate the physical network down to lane widths, road curvatures, and signal control placement. 

If VISSIM provides such detailed analysis, why not use it for every project? 

While VISSIM offers highly detailed and sophisticated analysis, its complexity adds to the resource requirements for each study. For years, traffic analyses have been successfully conducted without the use of VISSIM, often leading to similar conclusions at a lower cost. This makes it essential to view VISSIM as one of many tools in a larger toolbox. 

Although VISSIM provides greater detail than many other tools, that doesn’t mean those other tools are outdated or ineffective. Depending on the project’s needs, simpler tools may still provide the necessary insights without the added complexity. 

How does VISSIM add value? 

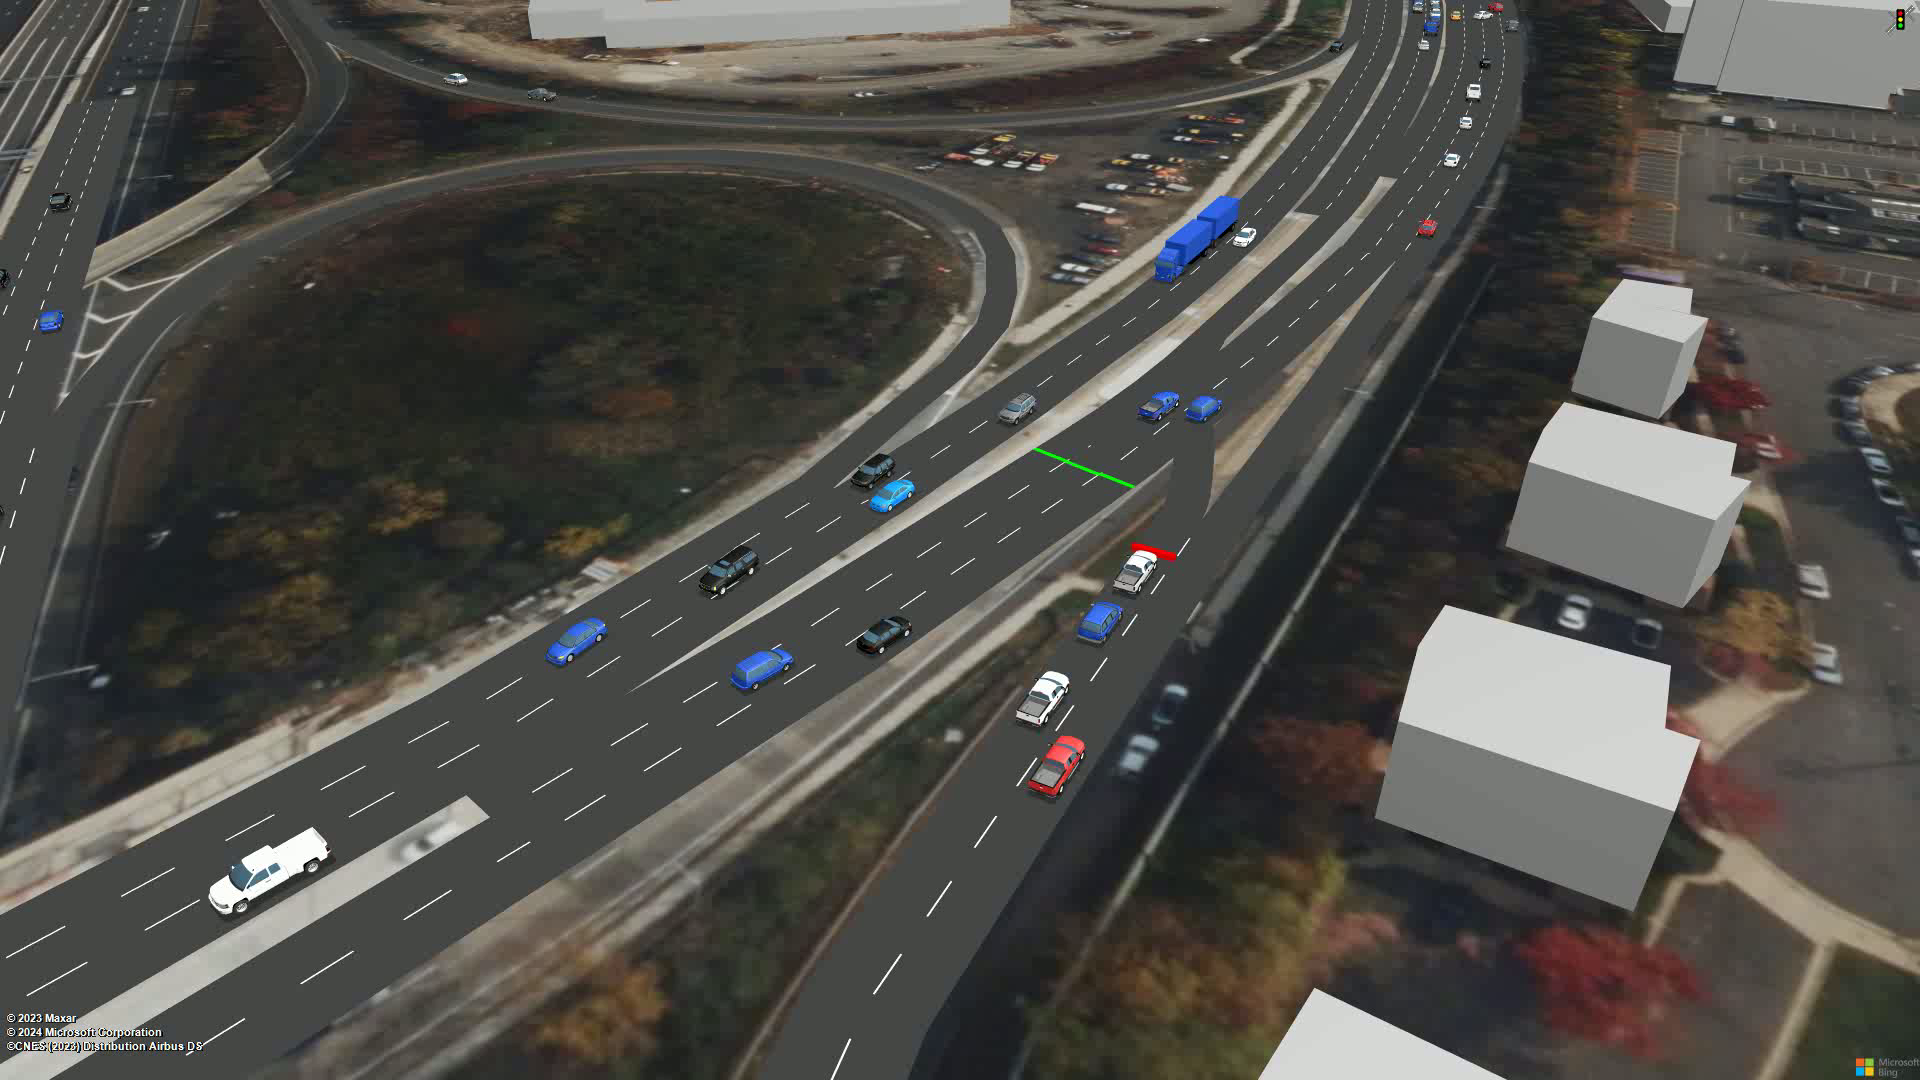
VISSIM’s strength lies in its granularity. It can provide metrics based on specific modes of transport, time periods, subareas, and more, allowing a detailed evaluation of nuances that other tools might miss. For instance, VISSIM can output data like transit and bicycle travel times, or pedestrian delays at crosswalks, showing how these metrics fluctuate over an hour. 

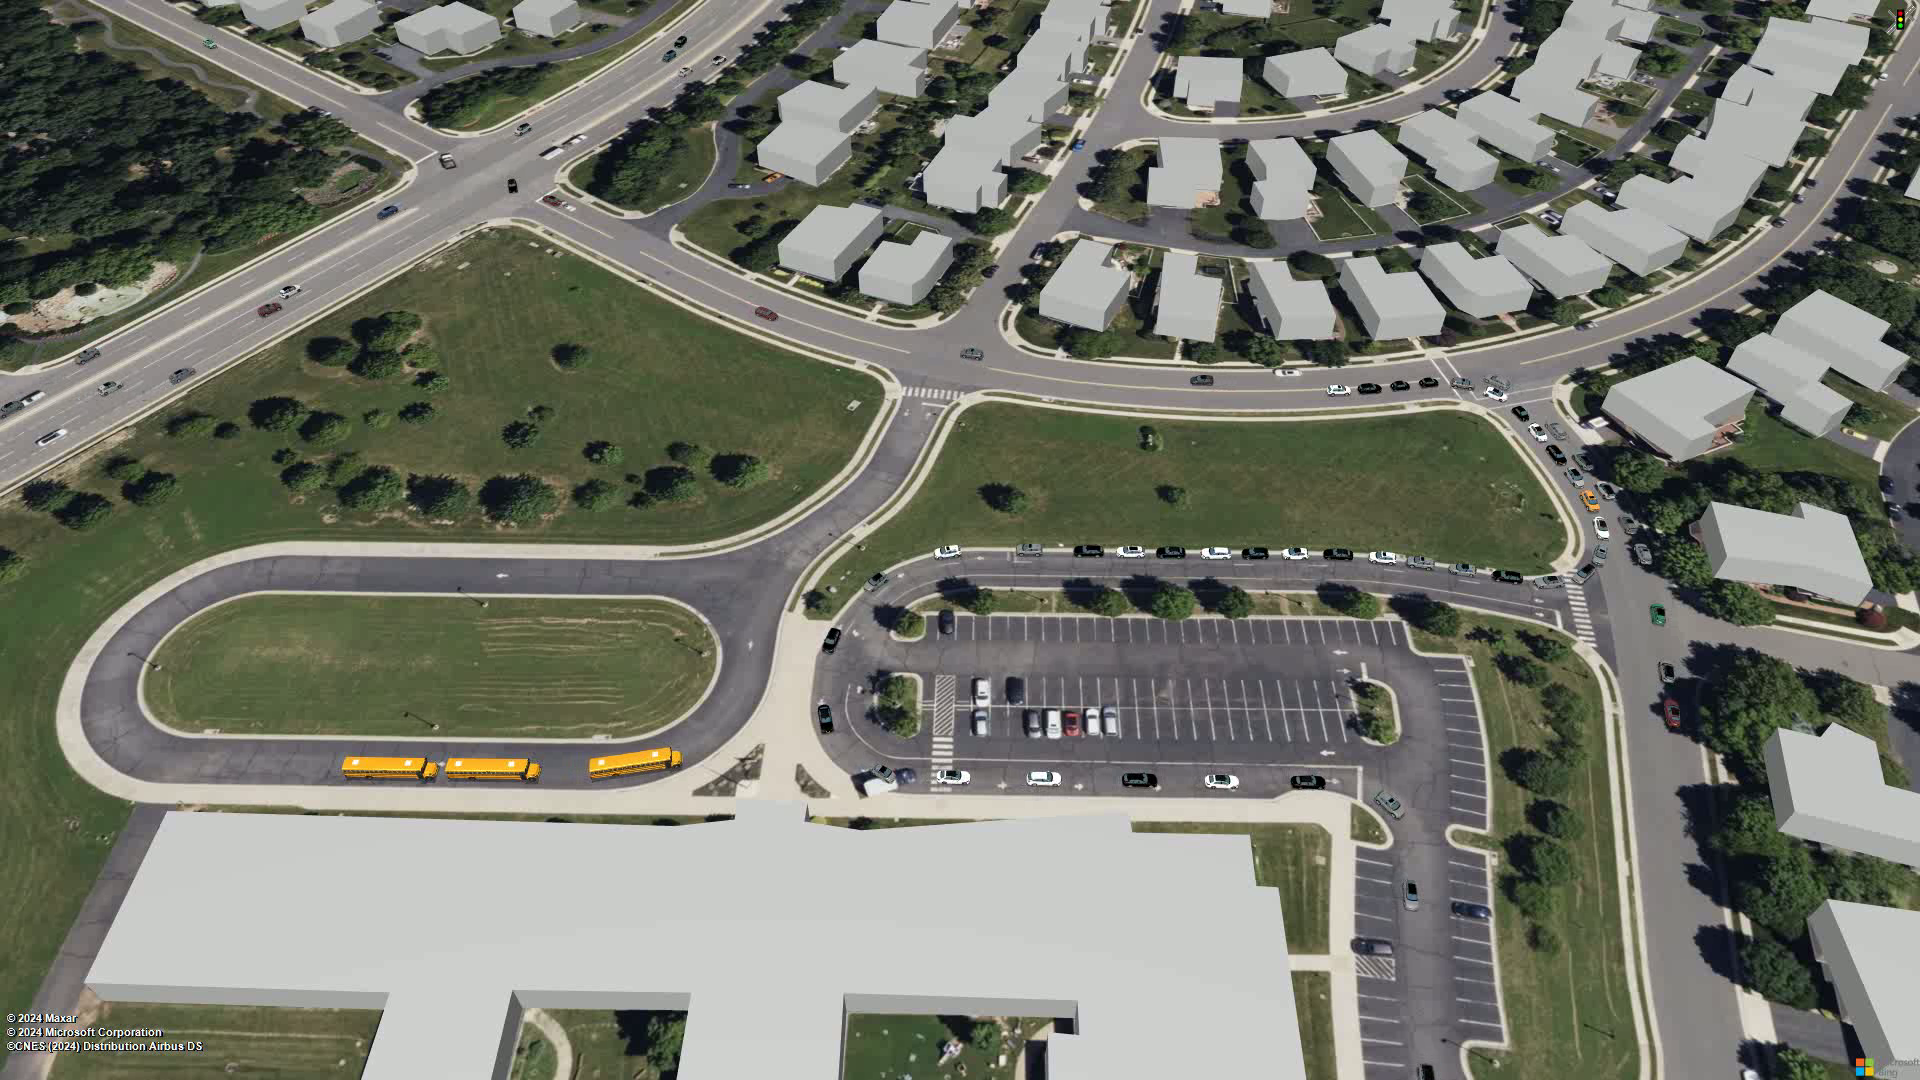
Additionally, VISSIM excels as a visualization tool. It can generate “bird’s-eye” views of transit systems, demonstrate bus circulation at a school, or even simulate a cyclist’s point of view in a new protected bike lane. This visual clarity helps communicate complex results to clients, public agencies, and stakeholders.

When is VISSIM the right tool for the job? 

While most transportation analyses can be handled with standard tools, certain projects benefit from VISSIM’s advanced capabilities. The decision to use VISSIM often depends on the project’s complexity and is typically made in consultation with the reviewing agency at the project’s outset. 

VISSIM is ideal for projects that include: 

  • Uniquely configured intersections or closely spaced signals
  • Networks with multiple facility types, such as freeway ramps connecting to urban roads
  • Frequent interactions between vehicles and active transportation modes (e.g., cyclists and pedestrians) outside of controlled locations 
  • Transit operations in dedicated lanes or rights-of-way separate from general traffic 
  • Oversaturated conditions where demand exceeds capacity during peak periods 
  • Dedicated non-vehicular facilities like shared-use paths or pedestrian malls 
  • Complex pick-up/drop-off (PUDO) operations
  • Major parking or tolling facilities 

Why Choose Gorove Slade for Traffic Simulation? 

Gorove Slade’s dedicated traffic simulation team is well-versed in VISSIM and other modeling programs. We’ve successfully applied VISSIM to a wide variety of projects, including: 

  • Freeways and urban intersections 
  • Pick-up/drop-off circulation patterns 
  • Bus Rapid Transit (BRT) systems, including queue jumps and dedicated lanes 
  • Pedestrian accommodations and crosswalk design 
  • Bicycle-specific traffic signals and protected bike lanes 

Whether you’re dealing with complex urban networks or specific multimodal interactions, our team is ready to tackle any project with the right tools and expertise. 

Tollbooth-style PUDO

Scramble-style PUDO

A scramble-style PUDO refers to when some (or all) students are being dropped off or picked up on the street, not an adjacent sidewalk, and walking between cars. For scrambles, some cars drive into a designated area, and then they all stop and don’t move again until all students arrive safely at the school or in their car at dismissal. Scrambles are often used during dismissal for schools with limited sidewalks since a scramble allows for more cars to load simultaneously.

Scramble-style PUDO

When helping plan a school, what does Gorove Slade recommend? In short, all of them. Our recommendation is to design a PUDO facility that can be flexible and work for several operational styles. Once up and running, the staff and teachers can try several and see what works best. The goal is to give them the tools they need to find the best solution.

An example is the new Cardinal Elementary School in Arlington, VA. We recommended a flexible system with ample sidewalks and a bypass lane, and once it was up and running, the facility operated a bit differently than planned. At dismissal, teachers split the facility in two, with two pick-up waiting spots – one for younger grades closer to the school and one for older ones further away. This allowed for quicker matching at dismissal times.

Afternoon pick-up at Cardinal Elementary School

PUDO Analysis

Gorove Slade handles the analysis of PUDO facilities in several ways. They are inherently tricky to analyze because some operational details are challenging to model, and the significant demand is very sensitive to variables leading to large ranges of results.

Here are three ways we approach analyzing PUDO:

Queuing Analysis/Equations

One method is to use classic queuing equations, which transportation engineers have used for decades for toll booths. They are based on three factors: the arrival rate of cars, the number of booths, and the processing speed of the toll. All three of these factors correspond to PUDO facilities.

Even so, queuing equations often fail to get accurate results for PUDO facilities. For example, we were working for a private school with a notorious PUDO problem at dismissal, so we went to the field and measured the arrival rate of cars, the number of vehicles that could load simultaneously, and the average time for each pick-up. We then entered that information into our queuing models, which then told us the queue should be negative, or in other words, there shouldn’t be a queue at all, as the car arrival rate was less than the overall number of cars that could be processed.

Subsequently, we returned to our observation notes and video. We realized the longest queue in the field was when dismissal began and that our model was correct in that the queue was being processed faster than additional cars arrived. Parents and guardians arrived so early that they stacked up well beyond the school property, but once dismissal started, the queue only got shorter as more cars showed up.

The lesson we learned here is that there are more factors in the queuing analysis than just the traditional three and that arrival rates are not random.

Comparable Analysis

A common transportation engineering practice is to study comparable locations, and sometimes, that works well for PUDO facilities, especially when queuing equations don’t work as described above. We’ve taken max queue data at several private and public schools. We can try to match the car length per student ratio from a site comparable to the one we’re working on, given the design and operational elements of their PUDO.

There are two issues with using comparable data. The first one is that there’s an extensive range of data, so using our observed data leads to a max queue range of 0.10 to 0.20 cars per student being picked up. The wide range is due to how well the PUDO processes traffic and the starting queue length. To use these ratios, you need to estimate how well the PUDO will operate within this range.

But more importantly, our observations found some schools with a max queue under the 0.10 cars per student range during dismissal. This wasn’t because they had fewer cars picking up students; it was because the cars weren’t all in the same place. For example, the school we observed once had around 25 to 30 cars picking up simultaneously, but only six were at the official pick-up spot at the front door. The others were in the parking lot or curbside in several locations. So, when planning PUDO facilities, the ability of parents to use informal locations near the school can be a huge factor in the max queues and overall PUDO operations.

VISSIM Modeling

When something other than engineering judgment combined with the two analyses stiles above is desired, we turn to detailed traffic models using the VISSIM software platform. VISSIM models are highly detailed and can account for things like starting queues and varying arrival rates. The main drawback is that they require more time and resources to assemble, and in the end, they still can’t arrive at a perfect representation of a PUDO since human behavior is always a factor.

Thoughtful design and operations can dramatically improve the pick-up and drop-off process. Whether planning a brand new PUDO experience or improving existing operations, the principles and methods discussed here provide a framework for tackling one of the most persistent logistical challenges for administrators and parents alike. By considering key factors like demand patterns, operational strategies, and facility types, schools can create systems that minimize queuing, reduce neighborhood impacts, and make the beginning and end of the school day better for all.